CRChart is a replacement charting library for Crystal Reports. It adds significant new charting capabilities for Crystal Reports designers and developers. This "replacement library" is 100% compatible with Crystal Reports. It simply expands your charting capabilities with additional features:
- User programmable lines on any axis (or free floating) with @CY, @CXY, @X, @YSZ, @YSZL, @YSZN, @YSZNL
- User programmable markers at any point on the chart. See @USER_MARKER, @USER_MARKER2
- Standard Error Bars & Error Bars with Median Band
- Pivot functions (Swap series/group, data reversal, etc...)
- Conditional Coloring and Formatting (@COND_COLOR)
- Runtime editing functions for most chart properties
- Drop Shadow and Alpha Channel 'transparency' effects
- Ability to use any Crystal Reports field or function as an input parameter to CRChart macros
- High-Quality Rendering (@HQ, @BEVEL, @CURVED_LINES)
These charting features are accessed through a set of special macro commands that are added to your custom chart module.
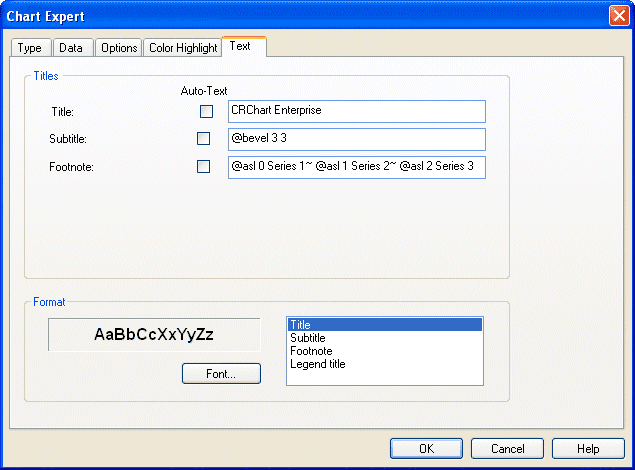
CRChart macros can be inserted in any chart title field (i.e., title, subtitle, footnote, etc.) field in a Crystal Reports chart. Chart titles are defined in the Chart Expert dialog or Chart Options or Titles dialog in some Crystal Reports versions.
- Right-click on the chart background and choose Chart Expert to show the Chart Expert dialog. Click the Text tab to show chart title fields.
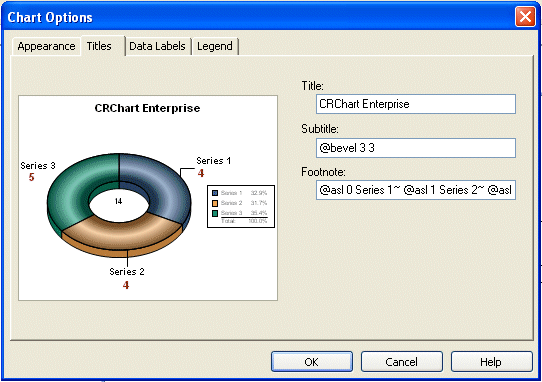
- For Crystal Reports Version 10 and lower, right click on the chart background and choose Chart Options to show the Chart Options menu. Choose Titles from the Chart Options menu to show the Titles dialog.
- For Crystal Reports Version 11 and higher, right click on the chart background and choose Chart Options to show the Chart Options dialog. Click the Titles tab to show chart title fields.
Even though macros are defined in the chart title fields, they will not appear as text in your chart. If you need to use a particular title field to define a chart title and to enter a macro, append a tilde (~) character and a space to the title and add the macro after the space. The space after the tilde is important. If it is not included, the macro will be ignored. EXAMPLE:
TitleText~ @3DSCATCRChart macros are not case-sensitive. All macros begin with an at-sign (@). There should be no space between the at-sign and the macro (i.e., @SWAP, not @ SWAP). Most macros include one or more parameters that further define the action of the macro. There must be one space after the macro and before the first parameter and a space between each subsequent parameter. EXAMPLE:
@USER_SERIES 2 3.6 3.8 MyNewSeriesMultiple macros may be defined in a single title field. When multiple macros are used, separate each macro with a space. EXAMPLE:
@BP2 @MK 8If the macro includes a string and multiple macros are defined in the same title field, a tilde (~) character must be appended to the end of the string parameter to indicate the end of the first macro and beginning of the next. EXAMPLE:
@AGL 2 Alias Label~ @BP2For macros that can be applied to a particular series in a chart, the nSeries parameter defines the series to which the macro is applied. In most cases, the nSeries parameter can be assigned a value in the range: minus one (-1)...n (where: n is the total number of series in the chart). For these macros, minus one is a special value that will apply the macro to all series in the chart. A value of zero (0) selects series 1.
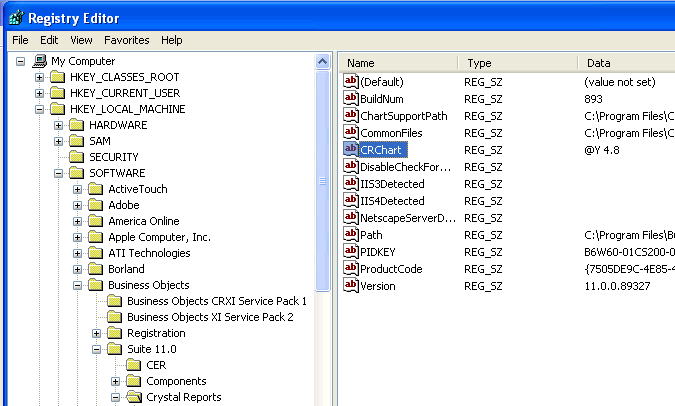
For Crystal Reports 11 and higher, CRChart can read macros directly from the registry.
For Crystal Reports 11, CRChart will look for a CRChart key at:
HKEY_LOCAL_MACHINE\SOFTWARE\Business Objects\Suite11.0\Crystal ReportsFor Crystal Reports 11.5, CRChart will look for a CRChart key at:
HKEY_LOCAL_MACHINE\SOFTWARE\Business Objects\Suite11.5\Crystal ReportsFor Crystal Reports 12.0, CRChart will look for a CRChart key at:
HKEY_LOCAL_MACHINE\SOFTWARE\Business Objects\Suite12.0\Crystal ReportsIf CRChart finds the key at ANY of these locations, it will parse the string for macro commands in the key. Parsing occurs AFTER all other title strings are parsed. It is the last to be evaluated after title, subtitle, footnote, Y1-title, X-title, etc.
EXAMPLE:
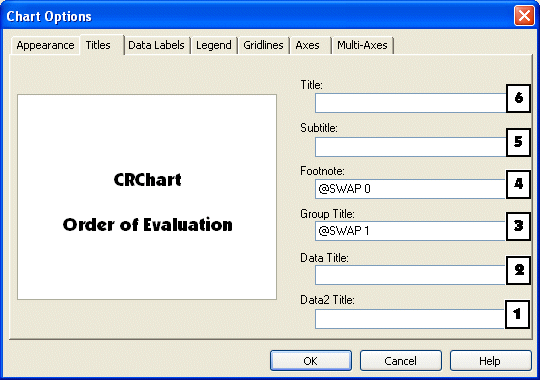
Because chart enhancement macros can be defined in any chart title field (i.e., Y2 Axis Title, Y1 Axis Title, X Axis Title, Footnote, Subtitle, or Title) or in a registry key, you could potentially define conflicting macros. To avoid this potential conflict, the macros are evaluated in the following order:
1) Data2 (Y2-Axis) Title
2) Data (Y1-Axis) Title
3) Group (X-Axis) Title
4) Footnote
5) Subtitle
6) Title
7) Macro defined in registry key (Crystal Reports 11 or higher only)
For example, assume "@SWAP 0" is defined in the Footnote field and "@SWAP 1" is defined in the Group Title field.
In this example, the "@SWAP 0" macro would be used because it is evaluated after the "@SWAP 1" definition.
If multiple macros are defined in the same title field, macros are parsed from left-to-right. For example, assume the following macros are defined in the Footnote field:
@SWAP 0 @SWAP 1In this example, "@SWAP 1" would be used because it is defined AFTER "@SWAP 0".
Many of the chart enhancement macros set a property of the chart and that property will remain set, even if the macro is removed from the field. For example, if "@SWAP 1" is used to reverse the series/groups in the chart, the series/groups will remain reversed even if the "@SWAP 1" macro is removed. A "@SWAP 0" macro is needed to return the series/groups to their normal/default order.
Some of the chart enhancement macros are NOT persistent and their effect will disappear when the macro is removed. For example the user-defined lines (set by @X, @Y, and @XY) and user-defined series labels (set by @ASL) only remain in the chart while the macro definition is in place. When the macro is removed, the user-defined line and/or series labels disappear.
The description of each macro identifies whether or not the macro is persistent.
Your existing reports with charts in them will look like they always have. The Chart Expert and Chart User Interface in Crystal Reports work like they always have. If you don't use the special macro commands in the title fields, you will notice no difference in your charting functionality. We work closely with Business Objects to ensure that CRChart is continuously upgraded to exactly match any bug fixes, enhancements or service pack changes made by Business Objects.
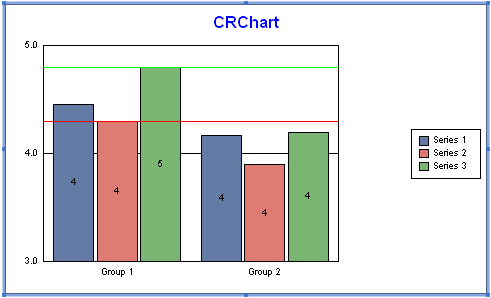
If your macro encounters an error, a red message will be displayed in the footnote area of the chart. Example:
The error message indicates the field (e.g., Group Title, Footnote, Subtitle, Title, etc.) and the macro where the error occurred. The most common errors are:
1) missing parameter(s)
2) parameter is assigned an out-of-range value
3) missing space between macro and parameter or consecutive parameters.
CRChart macros can be used in Chart Expert that comes with Crystal Reports. These fields can also be accessed programmatically via the ChartObject class. The following example code shows how CRChart macros can be used to change chart properties at runtime.
Dim crGraphObj As CRAXDRT.GraphObject

Set crGraphObj = crChart.OpenSubreport.Sections(1).ReportObjects.Item(1)

crGraphObj.FootNote = "@BP @SZ 35 "

    ....

crGraphObj.FootNote = crGraphObj.FootNote & "@MS " & CStr(iRow - Fractile135) & " " & CStr(iMarkerNumInSSCSDK80) & " "

    ....

'Set marker color in chart

crGraphObj.GroupsTitle = crGraphObj.GroupsTitle & "@MC " & CStr(iRow - Fractile135) & " " & CStr(r) & " " & CStr(G) & " " & CStr(B) & " "

    ....

'Control the Y1 axis scale on all plot areas

'Get Y Max and Y Min

GetCommonYMaxMin mvPlotYMaxMin, dYMax, dYMin

ScaleYMaxYMin dYMax, dYMin, strYMax, strYMin, iYDivision

    ....

crGraphObj.FootNote = crGraphObj.FootNote & "@SC " & strYMin & ", " & strYMax & " " & "@MK " & CStr(UBound(vReportData_Table_Marker, 1) - Fractile135)

crGraphObj.DataAxisDivisionMethod = crManualDivision

crGraphObj.DataAxisDivisionNumber = iYDivision
Using Crystal Reports Fields/Functions in CRChart Macros
You can use any field or function in Crystal Reports as a parameter for a CRChart Macro.
For Numeric Parameters:
- Add the report field or function that you want to use with a CRChart macro to the end of "Show value(s)" list in the Data tab of the Chart Expert dialog.
- Make a note of the zero-based position of this field in the "Show value(s)" list.
- In your CRChart macro, use the letter "P" followed by the number that represents the position in the "Show value(s)" list. The letter "P" is case sensitive (i.e., @Y p5 will not work).
IMPORTANT NOTES:
- Do not reference an item in the "Show value(s)" list that is part of the dataset being graphed (i.e., do not use "P0"). This would cause that particular data series to disappear.
- You cannot use the same "P" parameter twice (e.g., @USER_FILL P5 5 P5 5 is not valid). You could, however, drag the same field twice into the "Show value(s)" list so that they become P5 and P6 (e.g., @USER_FILL P5 5 P5 6 is valid).
- Only NUMERIC parameters (Integer, Boolean, Real) can be mapped.
- The letter "P" is case sensitive (i.e., @Y p5 will not work).
- Numeric parameter substitution will not work with two "On change of" items. Use @DATASET_MERGE and String Parameters instead.
EXAMPLE:
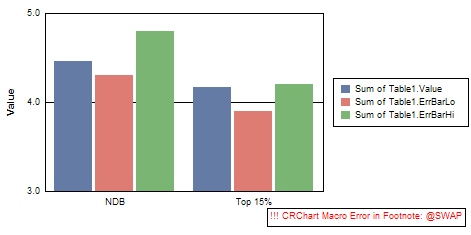
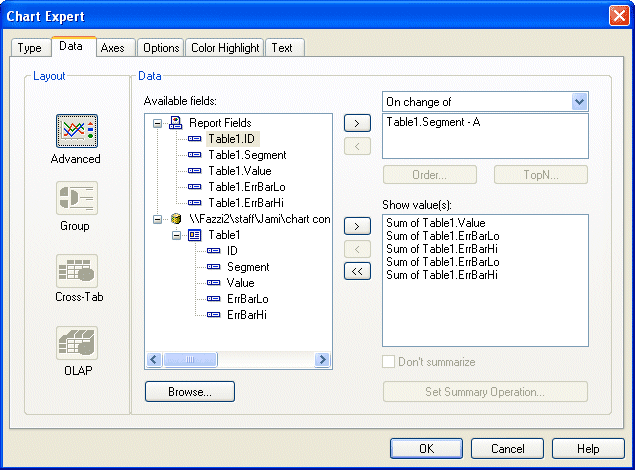
In the Data tab of the Chart Expert dialog, the "Sum of Table1.ErrBarLo" and "Sum of Table1.ErrBarHi" fields are added at zero-based positions 3 and 4 in the "Show value(s) list.
The @CY macro requires four numeric parameters identifying the location and color of a line to draw on the Y-Axis:
@CY fYValue nRed nGreen nBlueIn this example, the value of P3 (Sum of Table1.ErrBarLo) and P4 (Sum of Table1.ErrBarHi) are used as input parameters to identify the location of the lines:
@CY P3 255 0 0

@CY P4 0 255 0
The first @CY macro draws a red (255 0 0) line on the Y-Axis at value P3. The second @CY macro draws a green (0 255 0) line on the Y-Axis at value P4:
For String Parameters:
Legend labels that contain string~ prefixes can be extracted and used in CRChart macros that use numeric input parameters. Legend labels must be formatted with each prefix string terminated with a tilde (~) and a space:
String0~ String1~ ... Stringn~ Legend LabelPrefix strings must be numeric characters (0...9). Use the letter "S" and the zero-based position of the prefix string (e.g., S0, S1, S2, etc.) as an input parameter to any macro that requires a numeric (integer or real) value. When an Sn parameter is used as an input parameter to a CRChart macro, the prefix is stripped from the legend label and will not be shown in the legend area.
IMPORTANT NOTES:
- Sn parameters cannot be used as input parameters to macros that require a string parameter (e.g., @YSZ 1000 0 0 S0 will draw a line with the label "S0" and not the prefix at position S0).
- The letter "S" is case sensitive (i.e., @Y s1 will not work).
EXAMPLE:
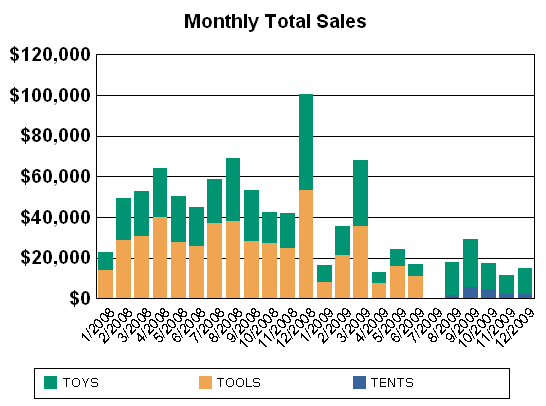
The legend label strings contain the following prefixes:
1~ 2008~ 24~ TOYS

1~ 2008~ 24~ TOOLS

1~ 2008~ 24~ TENTS
The @X_AXIS_MODE2 macro requires three numeric parameters that identify the start month, start year, and number of elements to cast X-Axis labels into day/month/year strings:
@X_AXIS_MODE2 nStartMonth nStartYear nElementsValue string prefixes from the legend labels are used as the input parameters to this macro:
@X_AXIS_MODE2 S0 S1 S2In this example, S0 (1) is used for the macro's nStartMonth parameter, S1 (2008) is used for the nStartYear parameter, and S2 (24) is used for the nElements parameter.
This macro creates X-Axis label strings beginning at nStartMonth S0 (1) and nStartYear S1 (2008) for nStartElements S2 (24). Note that the label prefix strings (1~ 2008~ 24~) are not included in the legend labels. They have been stripped out for use in the @X_AXIS_MODE2 macro.
CRChart 2021 is a product from
Three D Graphics, Inc.
Los Angeles, CA 90064 (threedgraphics.com)