Enterprise Solutions
SAP
CRChart
CR
Chart
Samples
Click on a sample to enlarge.
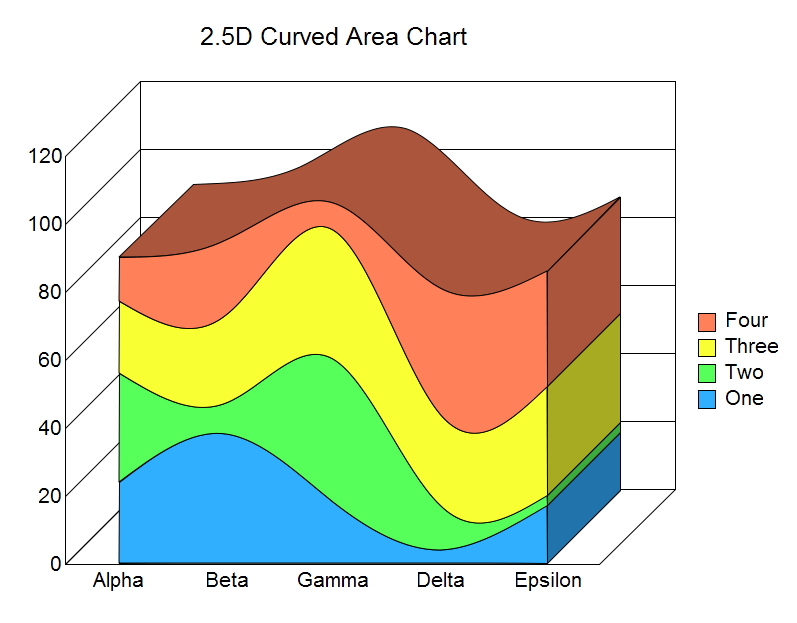
Anti-aliased, Smooth stacked area chart
Curved area chart with variable transparencies
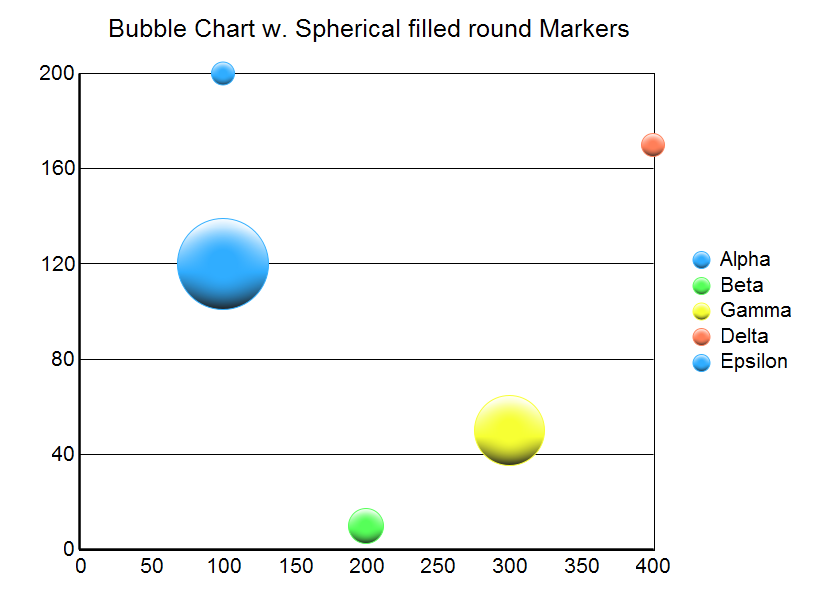
New spherical bevel for circular areas
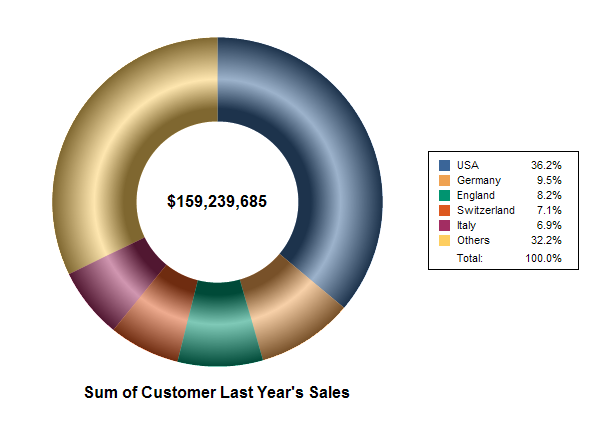
Dount pie chart with gradient bevel
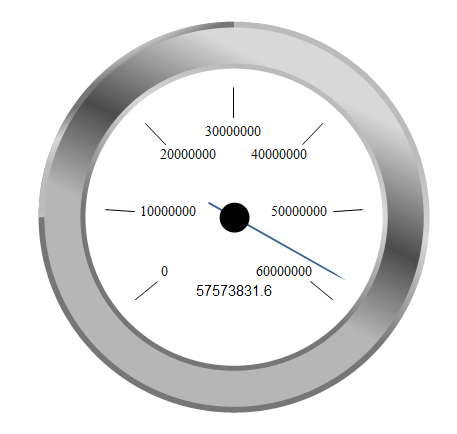
New clipped gauge border - border adjusts based on gauge start & stop angles
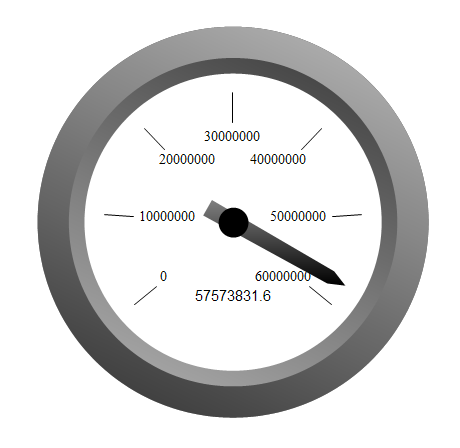
Gauge with gradient fill on border and gauge range, and multiple needles as markers
New 3D gauge border style
New Metallic gauge border style
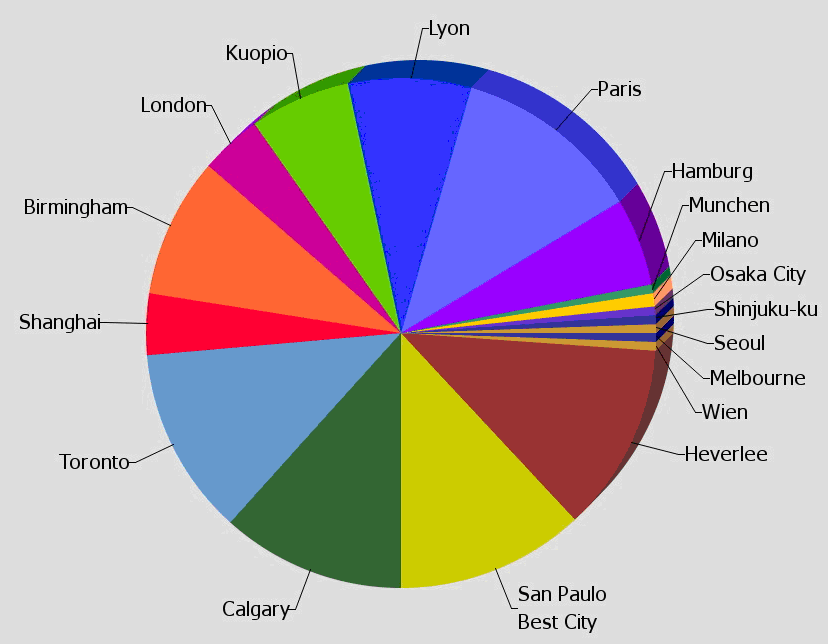
Advanced multi-slice pie label engine for a single pie
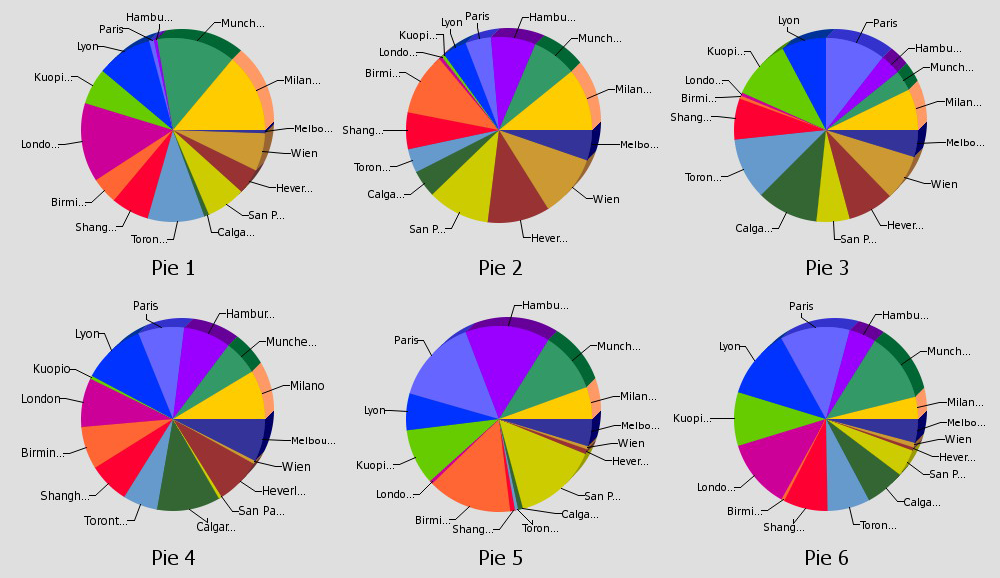
Advanced multi-slice pie label engine for multiple pies
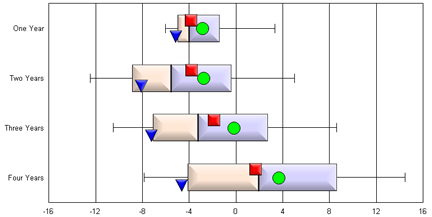
Box Plot chart with rectangular bevel fill
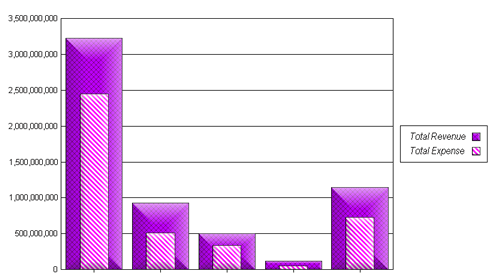
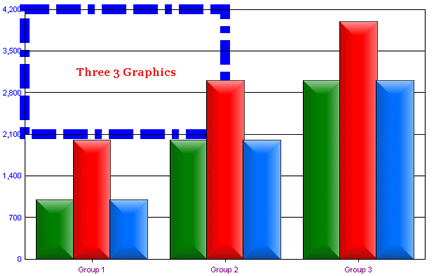
Bar chart with bevel and pattern fill
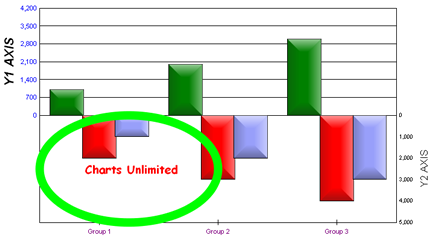
Advanced axis spacing options
User defined area with label
User defined elliptical area with label
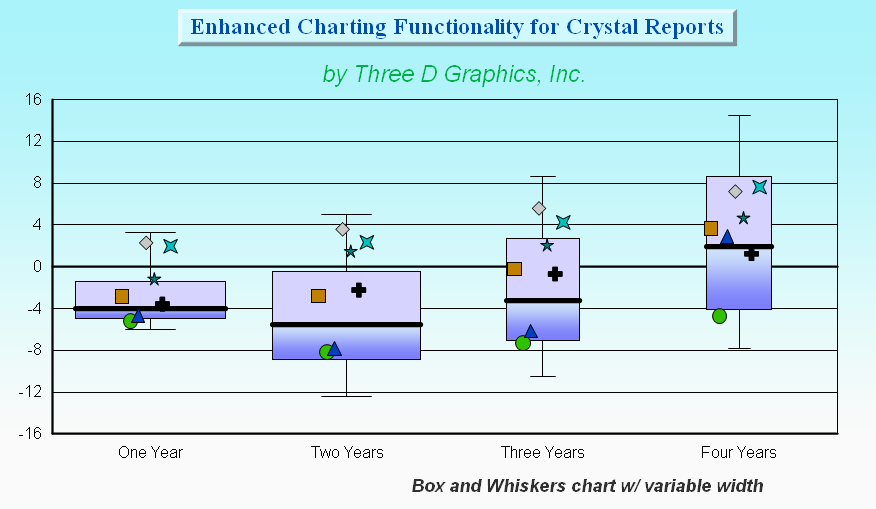
Box Plot Chart with variable width boxes
Smooth Line Curve with Histogram
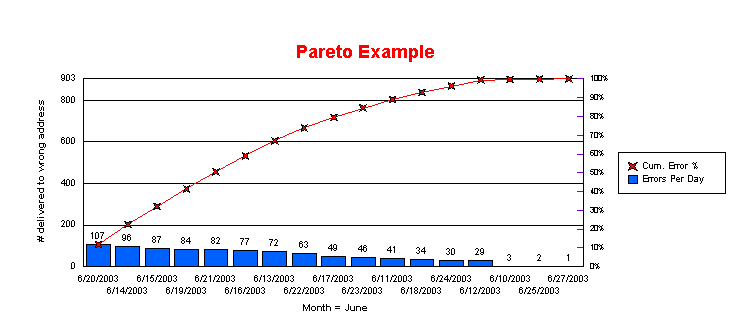
Pareto Chart
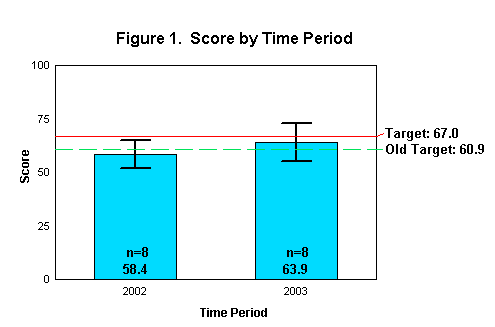
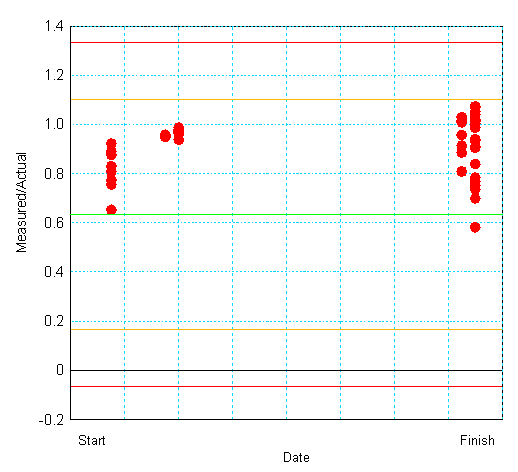
Error Bars and User Defined Lines
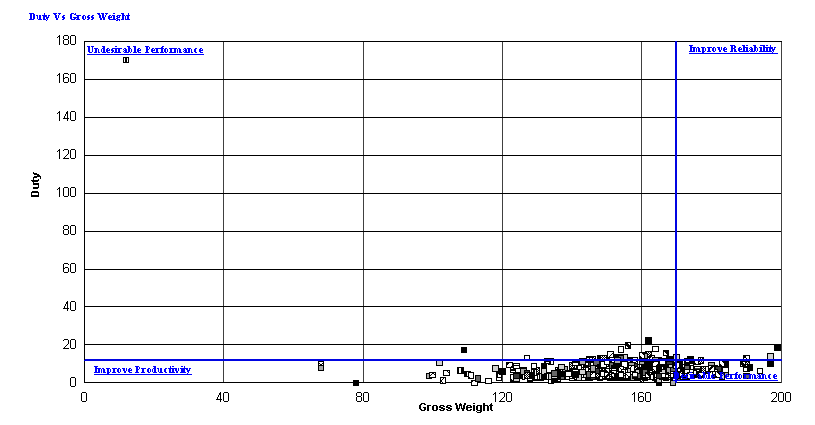
Scatter Chart with User Defined Lines
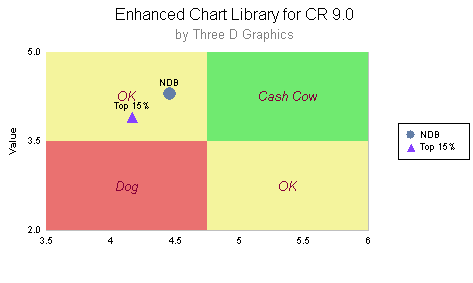
User Defined Regions
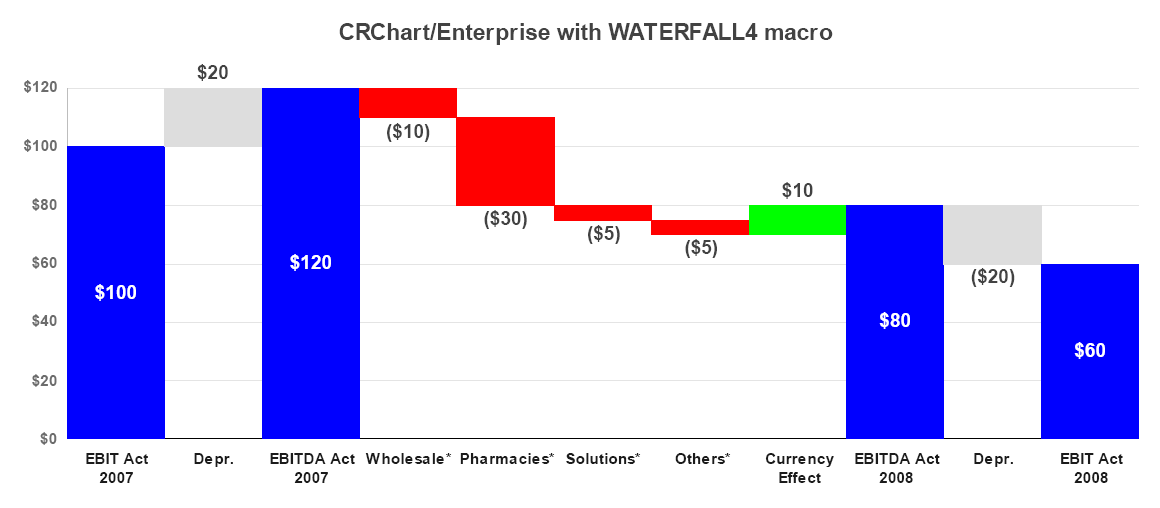
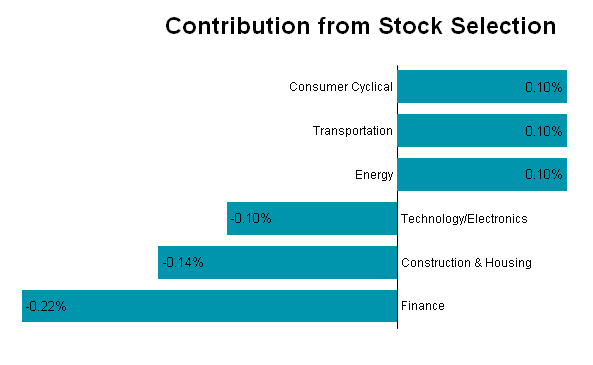
Waterfall Chart
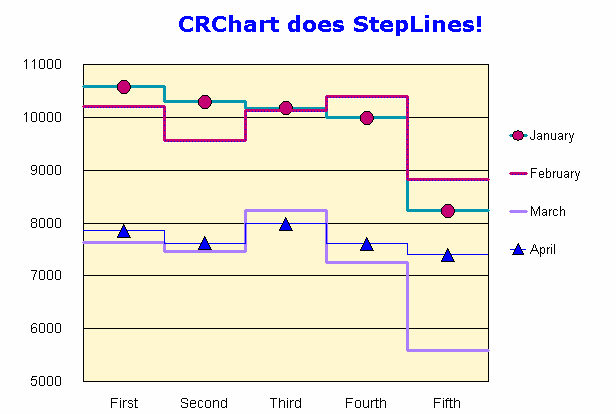
Step Line Chart
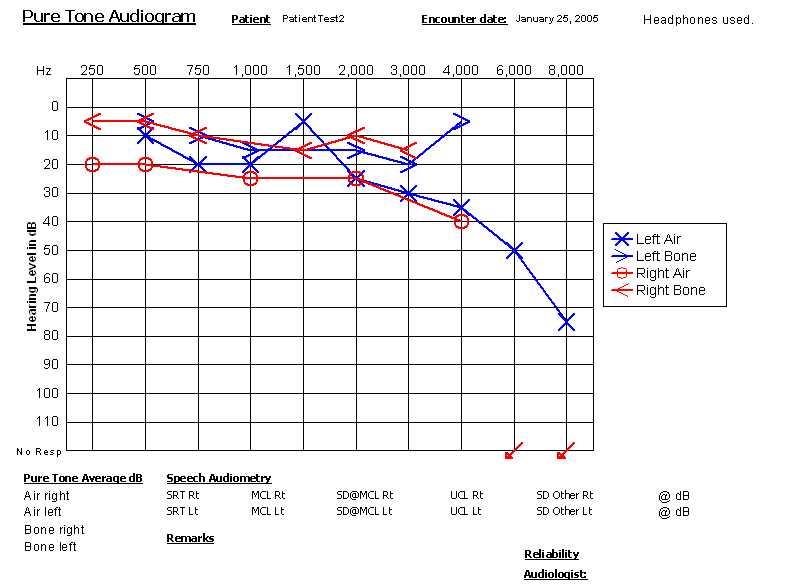
Audiogram Chart
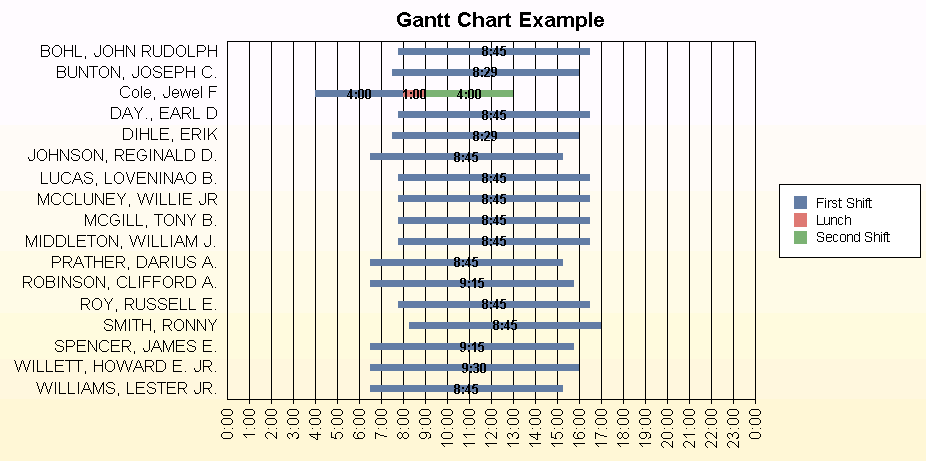
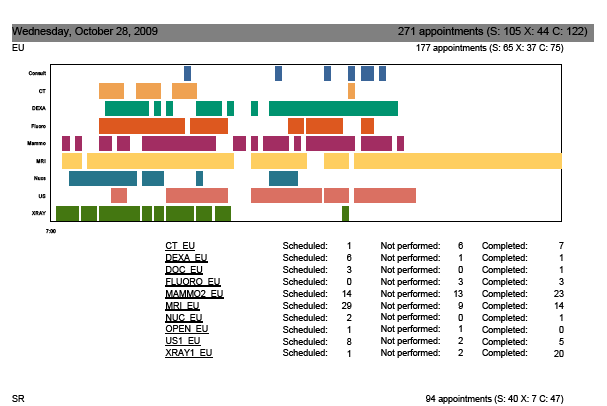
Gantt Chart
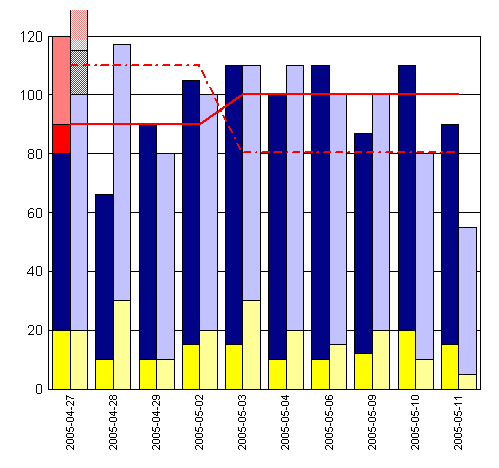
Stacked Bars with Absolute Lines
Conditional User Lines and Programmable Markers
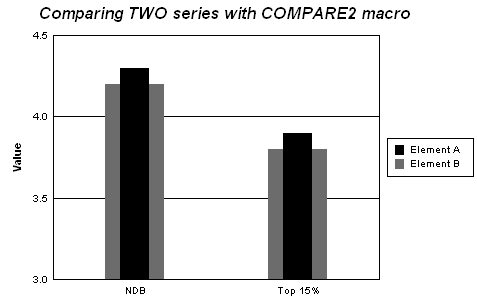
Using the new @COMPARE2 macro to compare 2 series
Custom @USERFILL macros working with runtime data
Shewhart Chart
Multiple Boxplots with various custom chart elements
Process Control Chart
Advanced Gantt Chart
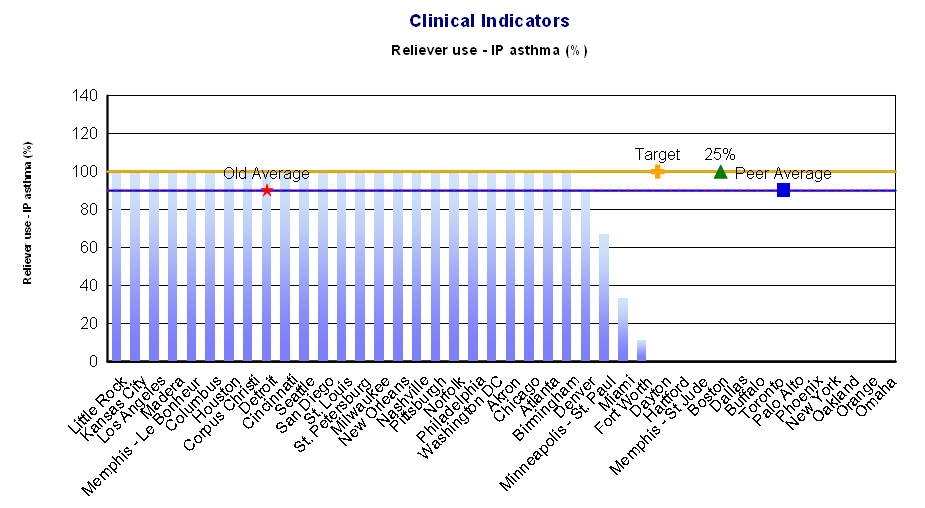
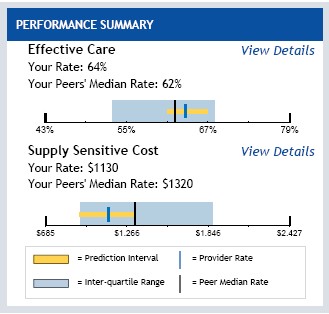
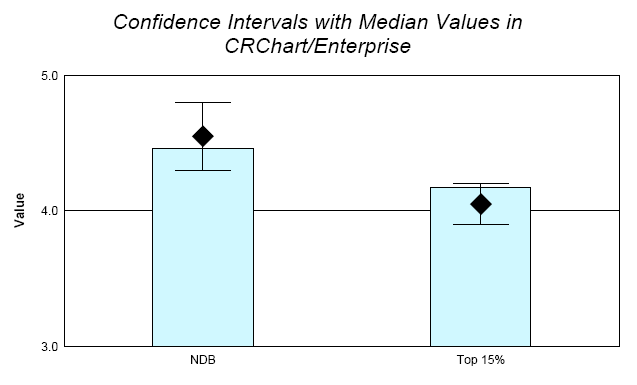
Confidence Intervals with Median Values
Group Labels on Baseline
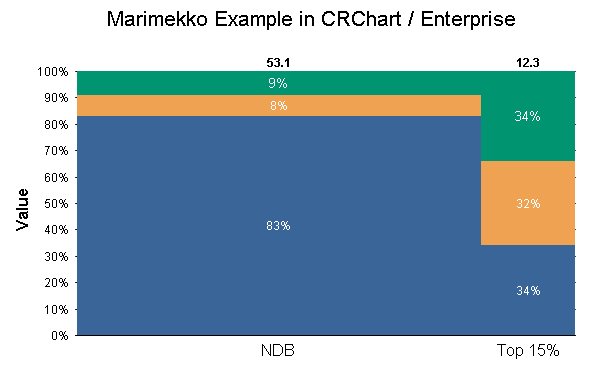
Marimekko (Mosaic) Chart
Funnel Plot Chart
Back To Top